









Nashville Visitor Numbers
The newest full-year figures put Davidson County at 17.4 million day and overnight visitors in 2025, spending $11.6 billion. The Nashville Convention & Visitors Corp published them on Aug. 31, 2026 from Tourism Economics and Tennessee Department of Tourist Development research. For an owner, the totals describe the size of the market; the hotel results, the airport count and the permit supply describe the competition for each night.
- Visitors, 2025
- 17.4 million, day and overnight
- Visitor spending, 2025
- $11.6 billion, up 3.5% on 2024
- State and local taxes from visitors, 2025
- $715.8 million state, $477.8 million local
- Hotel occupancy, 2025 (STR data via NCVC)
- 67.0%, average daily rate $199.20
- Airport passengers, 2025
- 25.7 million at BNA, up 4.6%
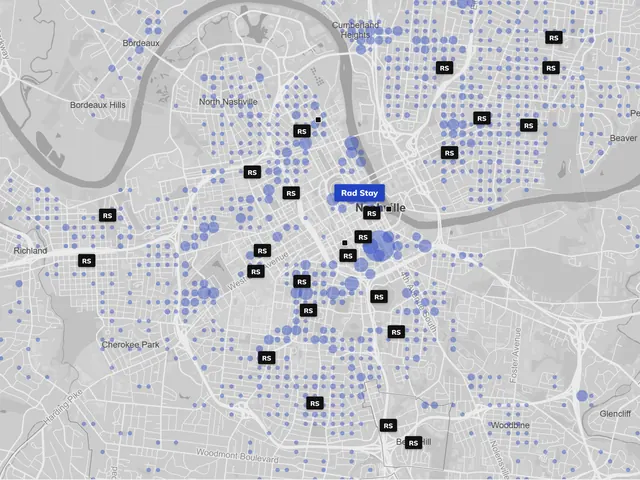
- Issued STR permits, countywide
- 7,022 (Metro open data, retrieved Oct. 6, 2026)
- Latest published year
- 2025
On this page
- The 2025 totals
- Taxes, jobs and pay
- Jobs, pay and the household tax figure over three years
- Davidson County within Tennessee
- Three years side by side
- Reading the visitor counts with care
- Where the visitors come from
- Hotel results for 2025
- Air access
- How many permitted rentals compete for the same guests
- The forecasts and their source
- Using these numbers on a building
- Questions
- Sources
The 2025 totals
Spending by visitors to Davidson County hit $11.6 billion in 2025, a record and a 3.5% gain, says the NCVC release dated Aug. 31, 2026. Spread across the year, that is close to $31.8 million each day. The county counted 17.4 million visitors. That figure includes people who came for the day and went home, so it is larger than the number who needed a bed.
Dividing the two totals gives about $667 per visitor, our own arithmetic from the release. NCVC's research page, updated Sept. 28, 2026, carries a Tourism Economics estimate for 2026 of $683 per visitor and $320 per day; that is an estimate for the current year, not a measured result. Quote the published figure with its year, and treat both as averages across day trippers, business travelers and long weekends alike.
Taxes, jobs and pay
The same release puts the tax yield of direct visitor spending at $715.8 million for the state and $477.8 million for local governments, about $1.2 billion together. It repeats the state report's estimate that each Nashville household would owe $3,674 more a year in state and local taxes without those payments.
Visitor spending supported $3.2 billion in labor income in the county. NCVC cites the U.S. Bureau of Labor Statistics for 74,000 leisure and hospitality workers in Davidson County, a count of the whole sector rather than of jobs caused by visitors alone.
Jobs, pay and the household tax figure over three years
The three releases also track the people who work in the trade. NCVC cited 73,000 leisure and hospitality workers in Davidson County in its 2023 release and 74,000 in its 2025 release, both from the Bureau of Labor Statistics. Labor income tied to visitor spending went from $2.84 billion in 2023 to $3.082 billion in 2024 and $3.2 billion in 2025. The 2023 release also gave a Tourism Economics count of 48,953 direct jobs generated by visitor spending.
The household tax figure has barely moved: $3,671 in the 2023 release, $3,678 in 2024 and $3,674 in 2025. Between the 2023 and 2025 releases, the sector's head count grew by about 1,000 workers; the 2024 release did not give one.
Davidson County within Tennessee
Davidson led all 95 Tennessee counties, and the release says it takes Shelby, Sevier, Knox and Hamilton counties added together to pass its total. Davidson's share of statewide visitor spending was about 35%.
Statewide, direct visitor spending reached a record $32.5 billion in 2025, up 2.7% against 1.9% for the nation, with growth in 57 of the 95 counties. The wider Greater Nashville region recorded $15.2 billion, up 3.3% on 2024 and 50% above 2018. Davidson County alone has grown 55.7% since 2018, against 40% for Tennessee and 22% nationally.
Three years side by side
Each year's release reported a record. The table puts the last three on one line each, using the figures as first published; a later release can revise an earlier year.
| Year | Visitors | Spending | Change | Per day | State and local taxes | Released |
|---|---|---|---|---|---|---|
| 2023 | 16.8 million | $10.77 billion | +8% | $29.5 million | $1.11 billion | Sept. 6, 2024 |
| 2024 | 16.9 million | $11.2 billion | +4.17% | $30.7 million | $1.157 billion | Aug. 26, 2025 |
| 2025 | 17.4 million | $11.6 billion | +3.5% | $31.8 million | $1.194 billion (sum of state and local) | Aug. 31, 2026 |
Reading the visitor counts with care
The visitor count rose by 100,000 from 2023 to 2024 and by 500,000 from 2024 to 2025, while spending rose faster than visitors in both years. More of the growth is coming from each visitor spending more than from more people arriving.
NCVC's research page warns that its headcounts now come from a Tourism Economics model, so lining them up against numbers produced under the old method gives a false comparison. Compare years only within the current series. Spending figures are a steadier guide across a long span than headcounts.
Where the visitors come from
For 2025, NCVC ranks the cities sending the most out-of-state visitors using phone-location data from Placer.ai. In order they are Atlanta, New York, Memphis, Chicago, Knoxville, Huntsville, Los Angeles, Chattanooga, Dallas and Bowling Green. Memphis, Knoxville and Chattanooga are in Tennessee, Huntsville is in Alabama and Bowling Green is in Kentucky, so half the list is a drive away.
The leading international markets, from Tourism Economics, are Canada first, then the United Kingdom, Japan, Mexico, Australia, Germany, the rest of Central America, Ireland, France and India. For a listing, the practical split is between guests who arrive by car and need parking and guests who fly in and need clear directions from the airport.
Hotel results for 2025
Hotels are the closest benchmark for a short-term rental, and NCVC publishes the county's 2025 results from STR, the hotel data firm. Room demand rose 2.6% to a record, above 2023. Occupancy was 67.0%. Rates slipped, with the average room going for $199.20 a night, 1.3% below the year before.
Supply grew faster than demand. Because the count of rooms grew 3.4%, revenue for each room on offer dropped 2.1%, though total room revenue still climbed 1.2%. The research page notes that annual room revenue has passed $2 billion in recent years. When new rooms outpace new guests, average rates soften, and a rental priced off last year's numbers can sit empty on ordinary nights.
Air access
Nashville's airport, BNA, set a passenger record of 25.7 million in 2025, up 4.6%, NCVC's research page reports. On a typical day 323 flights leave for 122 cities. The page adds that three quarters of the U.S. market sits two hours or less away by air and that international passenger demand at BNA has grown about 30% since 2015. Residents flying out are in that count too, so read it as a measure of air traffic rather than of visitors.
How many permitted rentals compete for the same guests
Metro's open data counted 7,022 residential short-term rental permits marked Issued across Davidson County on Oct. 6, 2026, the day it was retrieved. The largest single ZIP total, 1,706, sits in 37203. These are permits, not active listings, and a permit says nothing about how often a unit is booked.
On the hotel side, WSMV cited the Nashville Downtown Partnership's directory in September 2026 for about 67 lodging properties downtown with roughly 14,100 rooms. An owner pricing a downtown unit is competing with both.
The forecasts and their source
Looking ahead, the 2025 release forecasts county visitor spending of $12.2 billion in 2026, rising to $17.4 billion by 2036. These are NCVC's forecasts. We do not add our own, and the actual 2026 figure arrives only with the next annual release. The last three came out between Aug. 26 and Sept. 6.
Using these numbers on a building
Visitor totals tell you the market is large and still rising by a few percent a year. They do not tell you what a given unit will earn. For a specific building, the useful inputs are the hotel occupancy and rate trend, the number of permitted units nearby, the event calendar and the unit's own booking history.
Price each date on its own demand. A convention week, a stadium concert and a wet Tuesday in January are different markets inside the same annual average. Underwrite with the hotel rate trend in mind: a 1.3% fall in average daily rate in 2025, while visitors and spending rose, is the kind of detail an annual total hides.
Questions
How many people visited Nashville in 2025?
About 17.4 million, counting day trips and overnight stays, in 2025. Tourism Economics and the state tourism department produced the estimate, NCVC released it Aug. 31, 2026, and no later full year exists yet.
How much do visitors spend in Nashville?
$11.6 billion in 2025, about $31.8 million a day. For 2026, NCVC's research page gives a Tourism Economics estimate of $683 per visitor and $320 per day.
What was Nashville's hotel occupancy in 2025?
Hotels in the county filled 67.0% of their rooms, at an average of $199.20 a night, per STR figures on NCVC's site. That rate was 1.3% lower than in 2024. Room supply grew 3.4% and demand 2.6%.
Is Nashville tourism still growing?
Yes, more slowly. Spending rose 8% in 2023, 4.17% in 2024 and 3.5% in 2025. NCVC forecasts $12.2 billion for 2026.
Where do most Nashville visitors come from?
Atlanta comes first on NCVC's 2025 list, then New York, Memphis, Chicago and Knoxville. The other five of the ten are Huntsville, Los Angeles, Chattanooga, Dallas and Bowling Green. Canada and the United Kingdom led international markets.
What is the countywide count of issued rental permits?
7,022 issued permits countywide in Metro's open data retrieved Oct. 6, 2026. A permit is not the same as an active listing.
Sources
- Nashville Convention & Visitors Corp, Davidson County generated record $11.6 billion in visitor spending in 2025, Aug. 31, 2026
- Nashville Convention & Visitors Corp, 2024 visitor spending release, Aug. 26, 2025
- Nashville Convention & Visitors Corp, 2023 visitor spending release, Sept. 6, 2024
- Visit Music City, Research and hospitality statistics (updated Sept. 28, 2026)
- Metro Nashville, Residential Short Term Rental Permits (open data), status Issued, retrieved Oct. 6, 2026
- WSMV, Flagship hotel in Nashville won't be ready in time for Super Bowl 2030, Sept. 22, 2026
Checked November 12, 2026.
To keep this page, print it or choose Save as PDF in your browser's print window. The printout keeps the sources and the date.
More market data
All 15The New Nissan Stadium and the East Bank
Crews are finishing the Titans' enclosed stadium beside the Cumberland on the East Bank.
Downtown Nashville Development Projects
Downtown Nashville had 14 development projects under construction and 14 cranes in the air in the third quarter of 2026, according to the Nashville Downtown Partnership (NDP).
Population and Job Growth in Greater Nashville
The Nashville metro area had 2,197,416 residents on July 1, 2025, up 34,658 in a year by U.S.